Sleep + Recharge
UX Research, Visual Design, and Content Writing
Email Newsletter
In Progress
Thanks for your Patience!
Focus
Infographics
Content Writing
Research
Science Translation
Visual Design
Email Newsletter
Coherent Read
Tools
Sketch
Adobe Illustrator
Photoshop
Keynote
Unsplash
Preview
Adobe Acrobat
Overview
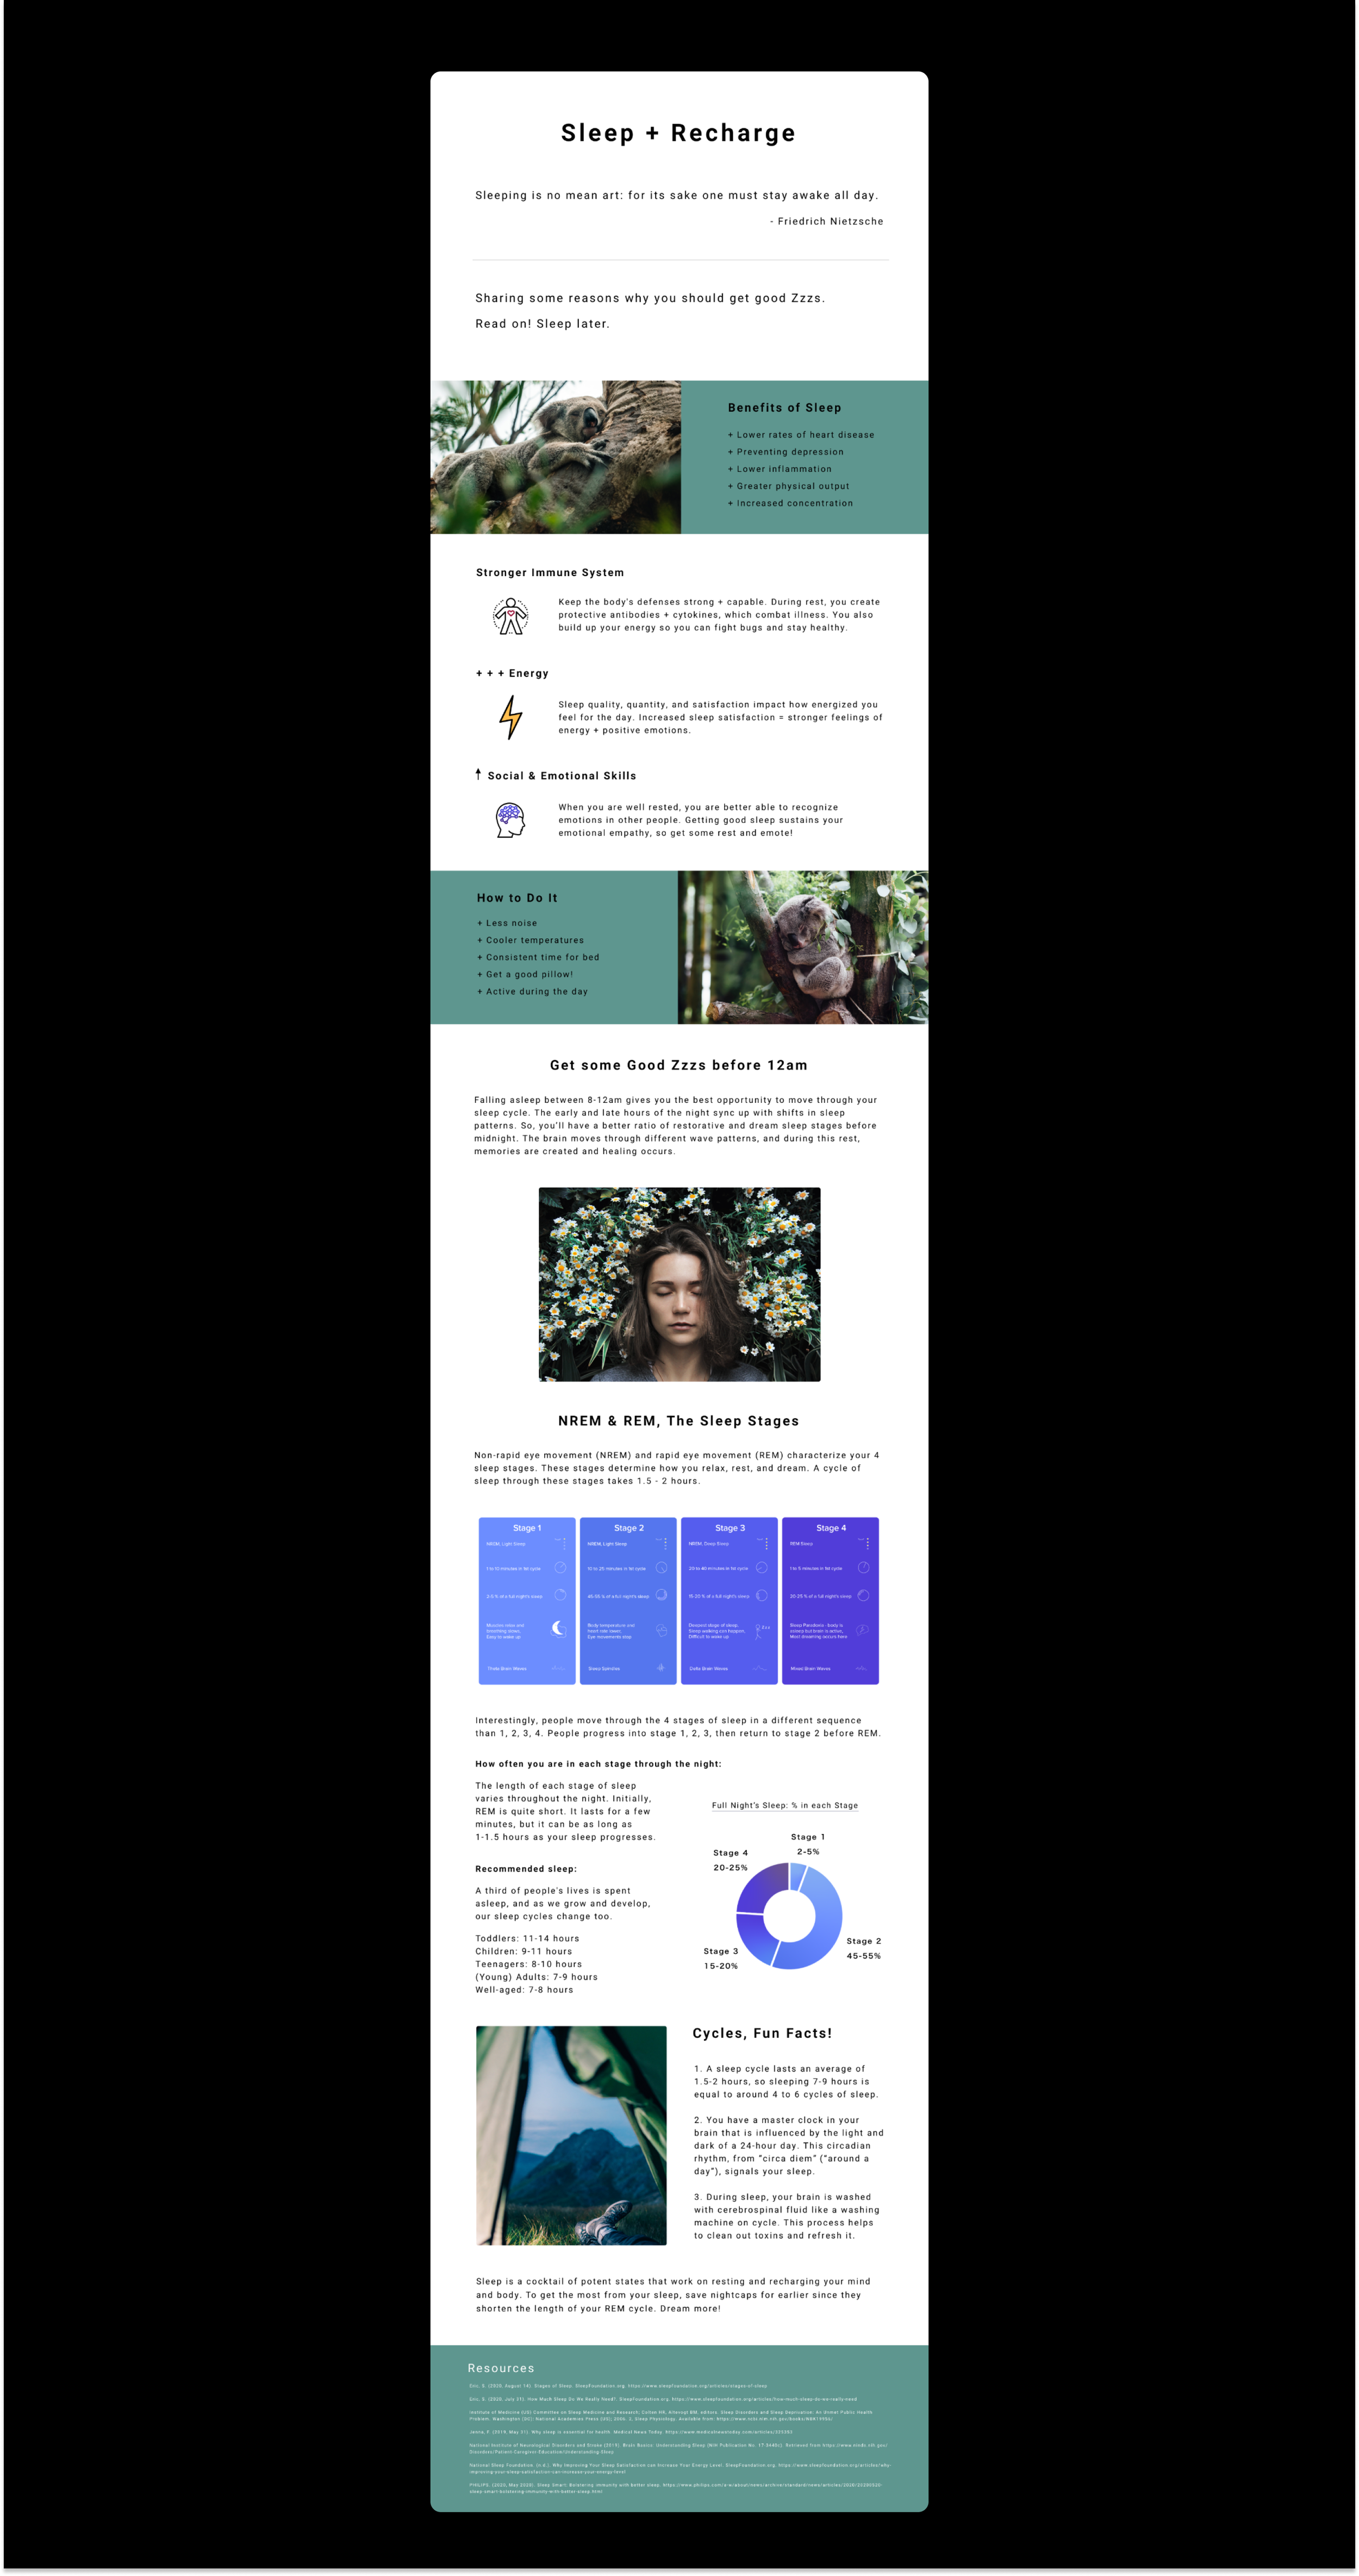
With 89% of people in the Nation reporting sleep problems, a read on how to get a better night’s sleep and how sleep works seems relevant for people who may want to learn more about their sleep patterns in a simple and engaging way. This project takes sciencey information, which can be dense at times, and utilizes infographics, a natural tone, and connected hierarchy for an informative, clear, and practical read, that may apply to readers’ lives and benefit their quality of sleep.
Current Problem
Research on health, and research in general, may take more time to understand and fully read than most people are willing to give to the enterprise. The time, technical terms, and effort to understand the article or paper may create a cognitive overload of information, where readers are more focused on piecing together the writing rather than on understanding the message. Because the effort it takes to read the science may override the enjoyment of learning something new, people may disengage from the content. This ultimately limits how often people search for information on health and how people may be able to relate to and connect useful information to their lives, when awake or asleep.
Envisioned Goal
The purpose is to communicate science on sleep in a creative but succinct way so that it has the potential to be effective in people’s lives.
With this, the focus is on emphasizing important and relevant information but translating it in an absorbable and informative way, so that content is more enjoyable, interactive, and likely to be remembered. People will be informed about science, while having the ability to apply it to their lives. This content would be accessible for every type of reader.
The goal is to clearly present the message, about sleep processes and benefits, with the least amount of cognitive effort, so that people will be able to learn about health, possibly feel bemused, and choose to actively apply the content to their different lifestyles. They will be able to share their knowledge, interesting insights, and new opinions with other people as well.
Keywords & Phrases
Sleep, Cycles, Waves, REM, NREM, Sleep Benefits, Sleep Stages, Recommended Hours, Koalas, Rest
Science Translation Problem and Accessibility of Science → Application to People’s Lives.
Problem and Goal Frontload.
Project Objectives.
Bring together a proto-persona’s key points, visual design elements, and visual and written content for a learnable read that packs a friendly punch.
01 . . . . . . . . . . . . . . . . . . . . . . . . . UX Design
02 . . . . . . . . . . . . . . . . . . . . . Visual Design
03 . . . . . . . . . . . . . . . . . . Science Reframe
01 UX Design
Define Research Topics + Synthesize Findings + Connect the Pieces + Plan for Visuals
The Design Focus
◈ Find and select relevant research.
◈ Utilize infographics, photos, and visuals to communicate the information.
◈ Draft a plan for the visual concepts based on how people learn content.
To define what sleep topics to highlight and present to people, an initial research phase determined the variety of topics being shared online and what themes appeared more often than other themes. With a mix of online content readily available, select topics were chosen for an engaging newsletter read. Based on the research, some more common and repetitive, and some less frequent but fascinating, the visual plan was loosely drafted, so that it had the adaptability to be adjusted for the project journey.
02 Visual Design
Select a visual theme, with an emphasis on colors, layout, and hierarchy.
The Design Focus
◈ Tone of voice and text choice, with titles like “Benefits,” and “How to.”
◈ Hierarchy, with space to take in, process, and connect content.
◈ Color choice, to highlight key areas and pair images and text together.
Visual information portrays a message and connects various topics together through the order it presents content, its hierarchy, and the way it is pieced together, it’s layout. The overarching theme of sleep is meant to provide health content to readers, so colors and fonts were chosen to represent this naturally occurring process. The layout and hierarchy connect the theme and related sleep topics, and additional themes utilize visuals and text, which combine for a salient message and reader experience.
03 Science Reframe
To the point text + related imagery + engaging and conversational tone + mood match
The Design Focus
◈ Tone of voice that is relatable, understandable, and clear.
◈ Passive to active learning with content taken off the page and into life.
◈ Related visuals with text and images interspersed throughout the read.
A conversational tone provides clarity and fluency for the reader to relate to the material and opportunity to interact with the message. For this read, interacting is looking at the visuals, taking time to process the content, and referring to it later, rather than disengaging by briefly scanning the material and leaving the email page. If it is relevant, sparks their interest, and indicates how it may benefit them, the message may anchor with individual understanding and be applied with user interest and content engagement.
Sleep Content & Research Pivot
Prioritizing what sleep information to share and what topics work together for type, visuals, and infographics on sleep.
Sleep Questions ⌇ Selection ⌇ Pivot ⌇ Redirection ⌇ Message
During the investigation of sleep topics, I read content that ranged from sleep stages, to sleep benefits, to what makes you fall asleep. The more I searched, the more I realized how much content was out there. I originally thought I would just write generally about sleep, but I didn’t realize how much breadth that encompassed with various sleep processes and its application to people’s lives. With an expanse of content, I decided too much information with a broad focus might actually cause readers to be distracted, while
narrowing in on specific themes would focus the content and even provide more informative depth for readers to learn about and process. Additionally, the related topics and resources are a way for readers to view relevant information in more detail but also move through individual reading tangents in people’s own time and pace. So, I brought together information that was able to be grouped in themes but also have their own diverse topics for readers to sample. This variety and overlap of content would connect themes and fortify the sleep science message. From this preliminary research phase, 5 themes were identified!
Narrow in on 5 Main Themes
The themes are landing points for people to take in content and learn about sleep pathways. These are the selected sleep themes from initial research.
Benefits
How to Fall Asleep
Brain
Sleep Stages
Cycles
Impact of Sleep on the Body
Ways to Improve Sleep Patterns
Defining the Sleep Process
How much Sleep is Best for Various Ages
Sleep Cycles Around Us
With a general population of people who are the users of this content read, the benefits of sleep and how sleep interacts with the body seemed most applicable for readers. Specific explanations on the sleep process, hours, and cycles are places to jump in to learn more details, with interesting facts interspersed through the text and visuals.
Sleep Themes + Their Pathways
User Personas
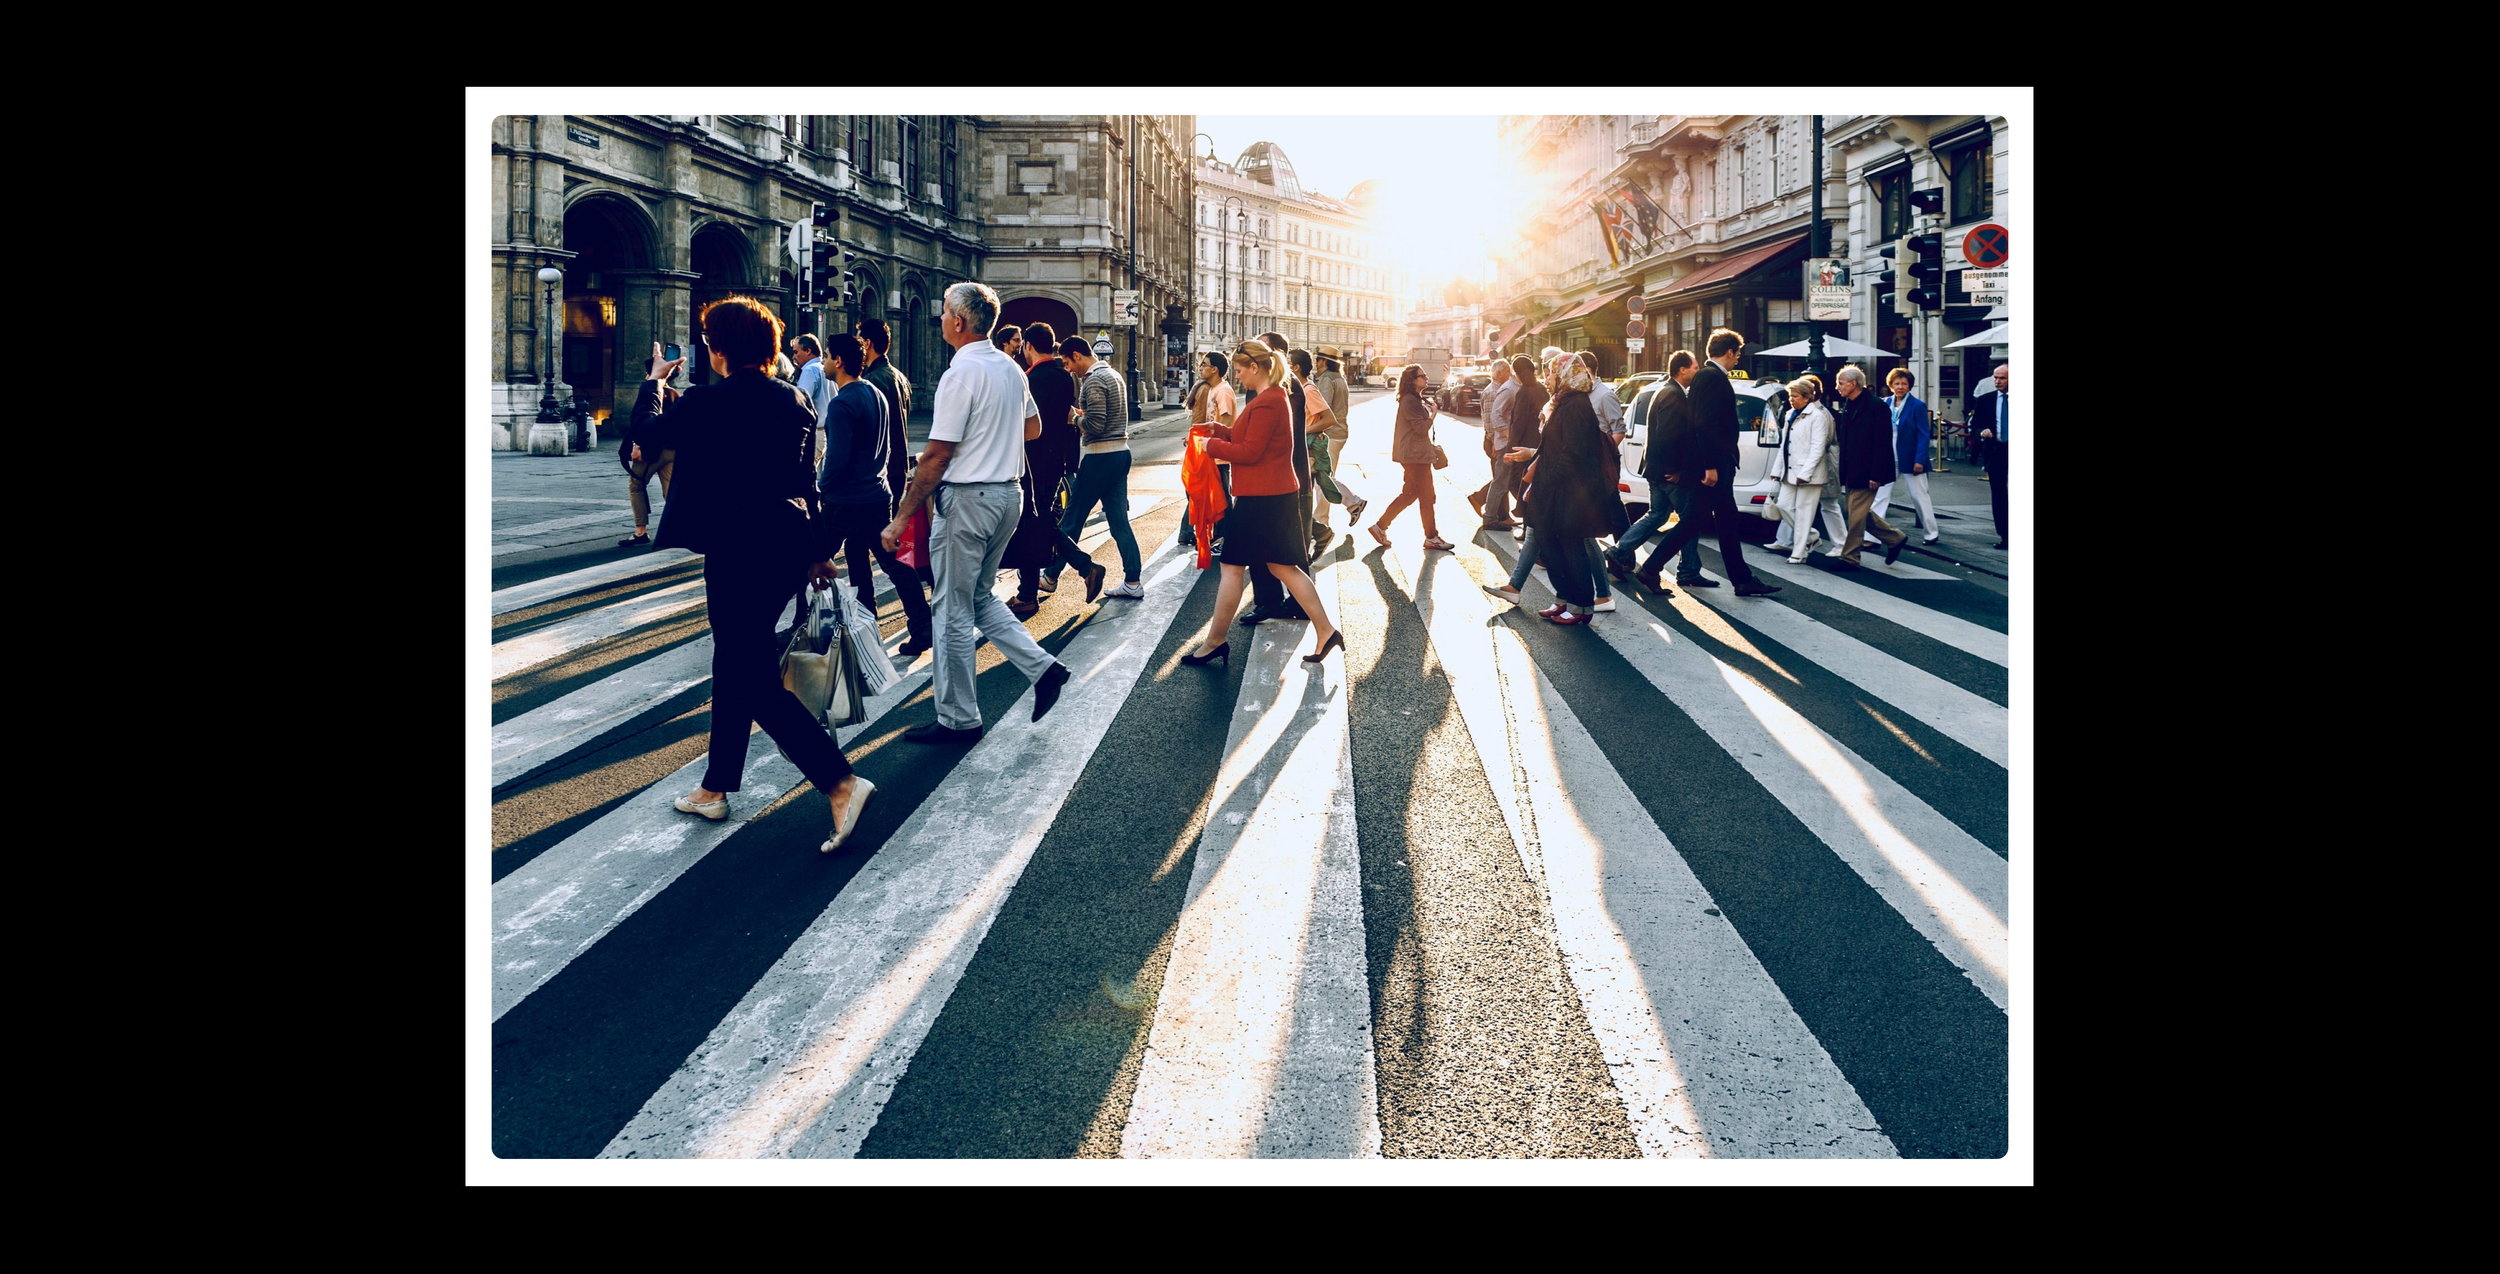
People who sleep, people who read online articles, people who commonly interact with technology, and people who are interested in their health.
Parent → Coworker → Graduate → Cousin → Sister
With people sleeping for 1/3 of their lives, link, and with fewer than 1% of people needing less than 6 hours of sleep a night, link, the user focus is applicable and generalized to most people. For the purpose of the email newsletter, the user group also consists of people who have access to email and frequently use technology in their lives.
+ + + Energy
CONTENT COPY: “Keep the body’s defenses strong & capable. During rest, you create protective antibodies, which combat illness. You also build up your energy, so you can fight bugs and stay healthy.”
⬆ Social & Emotional Skills
Intention and Why: Sleep influencing people’s ability to feel equipped for their day is commonly communicated in articles. Sleep relating to people’s emotions and social skills was more particular. This was an unusual but cool fact for people to learn.
Benefits + Sleep in the Body
Intention and Why: With people looking to prevent illness and combat its effects when they catch a bug, it seemed relevant and beneficial to start with how sleep influences the immune system’s ability to fight different kinds of bugs.
Stronger Immune System
Intention and Why: During research, the concept of sleep satisfaction was explained, where people may have high amounts of sleep but low sleep satisfaction. So, I wanted to include how well a person sleeps relates to their well-being.
CONTENT COPY: “Sleep quality, quantity, and satisfaction impact how energized you feel for the day. Increased sleep satisfaction = stronger feelings of energy and positive emotions.”
CONTENT COPY: When you are well rested, you are better able to recognize emotions in other people. Getting good sleep sustains your emotional empathy, so get some rest and emote!
Intention and Why: The benefits of sleep start the article so readers are hooked into learning how their sleep may improve the quality of how they function throughout the day.
CONTENT COPY:
+ Lower rates of ♡ disease
+ Prevent depression
+ Lower Inflammation
+ Greater physical output
+ Increased concentration
How To Fall Asleep
Intention and Why: After starting with sleep benefits and describing a few in detail, sharing how to get better sleep wrapped up the section and connected the benefits to actions.
CONTENT COPY:
+ Less noise
+ Cooler temperatures
+ Consistent time for bed
+ Get a good pillow
+ Be active during the day
Email Design Process, Piecing it Together
People’s Sleep Mechanisms + Process
What happens during sleep?
Physiologically people’s bodies move through sleep stages and people’s brains shift through various waves and sleep cycles. With people’s different lifestyles, such as an early bird professor or a night owl student, and with people’s diverse personal, social, and extracurricular events, sleep results vary for each individual.
Intention and Why
Content
The Body, the Brain, and 4 Sleep Stages
“Falling asleep between 8pm - 12am gives you the best opportunity to move through your sleep cycle. The early and late hours of the night sync up with shifts in sleep patterns. So, you’ll have a better ratio of restorative and dream sleep stages before midnight. The brain moves through different wave patterns, and during this rest, memories are created and healing occurs.”
The Brain
Describing the process of sleep, what happens physiologically to people, and how this relates to their lifestyles seems like a main sleep topic people would be interested in learning. After an overview of the benefits of sleep and how to sleep, a main message for readers is sleep’s mechanisms and how people experience the sleep stages.
As people sleep, the brain is active as well, but in a different manner than when people are awake. The brain relays to the body that it is time to rest and communicates to the muscles and systems of the body that it is time to relax so that restful and healing processes are able to occur. Through the 4 sleep stages, the people’s brain sends signals to various areas of the brain. Beta, Alpha, Theta, Sleep Spindles, Delta, and Gamma are the brain waves that are transmitted in the brain during the 4 sleep stages and mix of sleep cycles.
Sleep Process
People’s breathing slows and heart rate lowers at the start of the sleep process. During sleep, people shift through various physiological states where the respiratory, cardiovascular, and nervous system change as people move though the stages and cycles of sleep. As the sleep process culminates, people notice sounds, temperature, and their body resting as they wake up to their day.
People
People move through the stages of sleep in cycles as their sleep progresses. Over time, the sleep cycles shorten in duration but people’s REM sleep and dreams increase in duration.
While sleep is usually a consistent process for people, people’s careers, life habits, and resting hours may show up as differences in feelings of energy, rest, and mood, since healthy sleep patterns are more closely connected to the light of day and dark of night. This syncing of sleep and wakefulness with the 24 hour day’s shift of sunlight is known as the circadian rhythm and falling asleep during the hours of 8pm - 12am is the most beneficial for people.


Research on sleep science, information architecture on the infographics, and a proto-persona on the general users inform the content, layout, and hierarchy of the text and visuals for a coherent and user-friendly read.
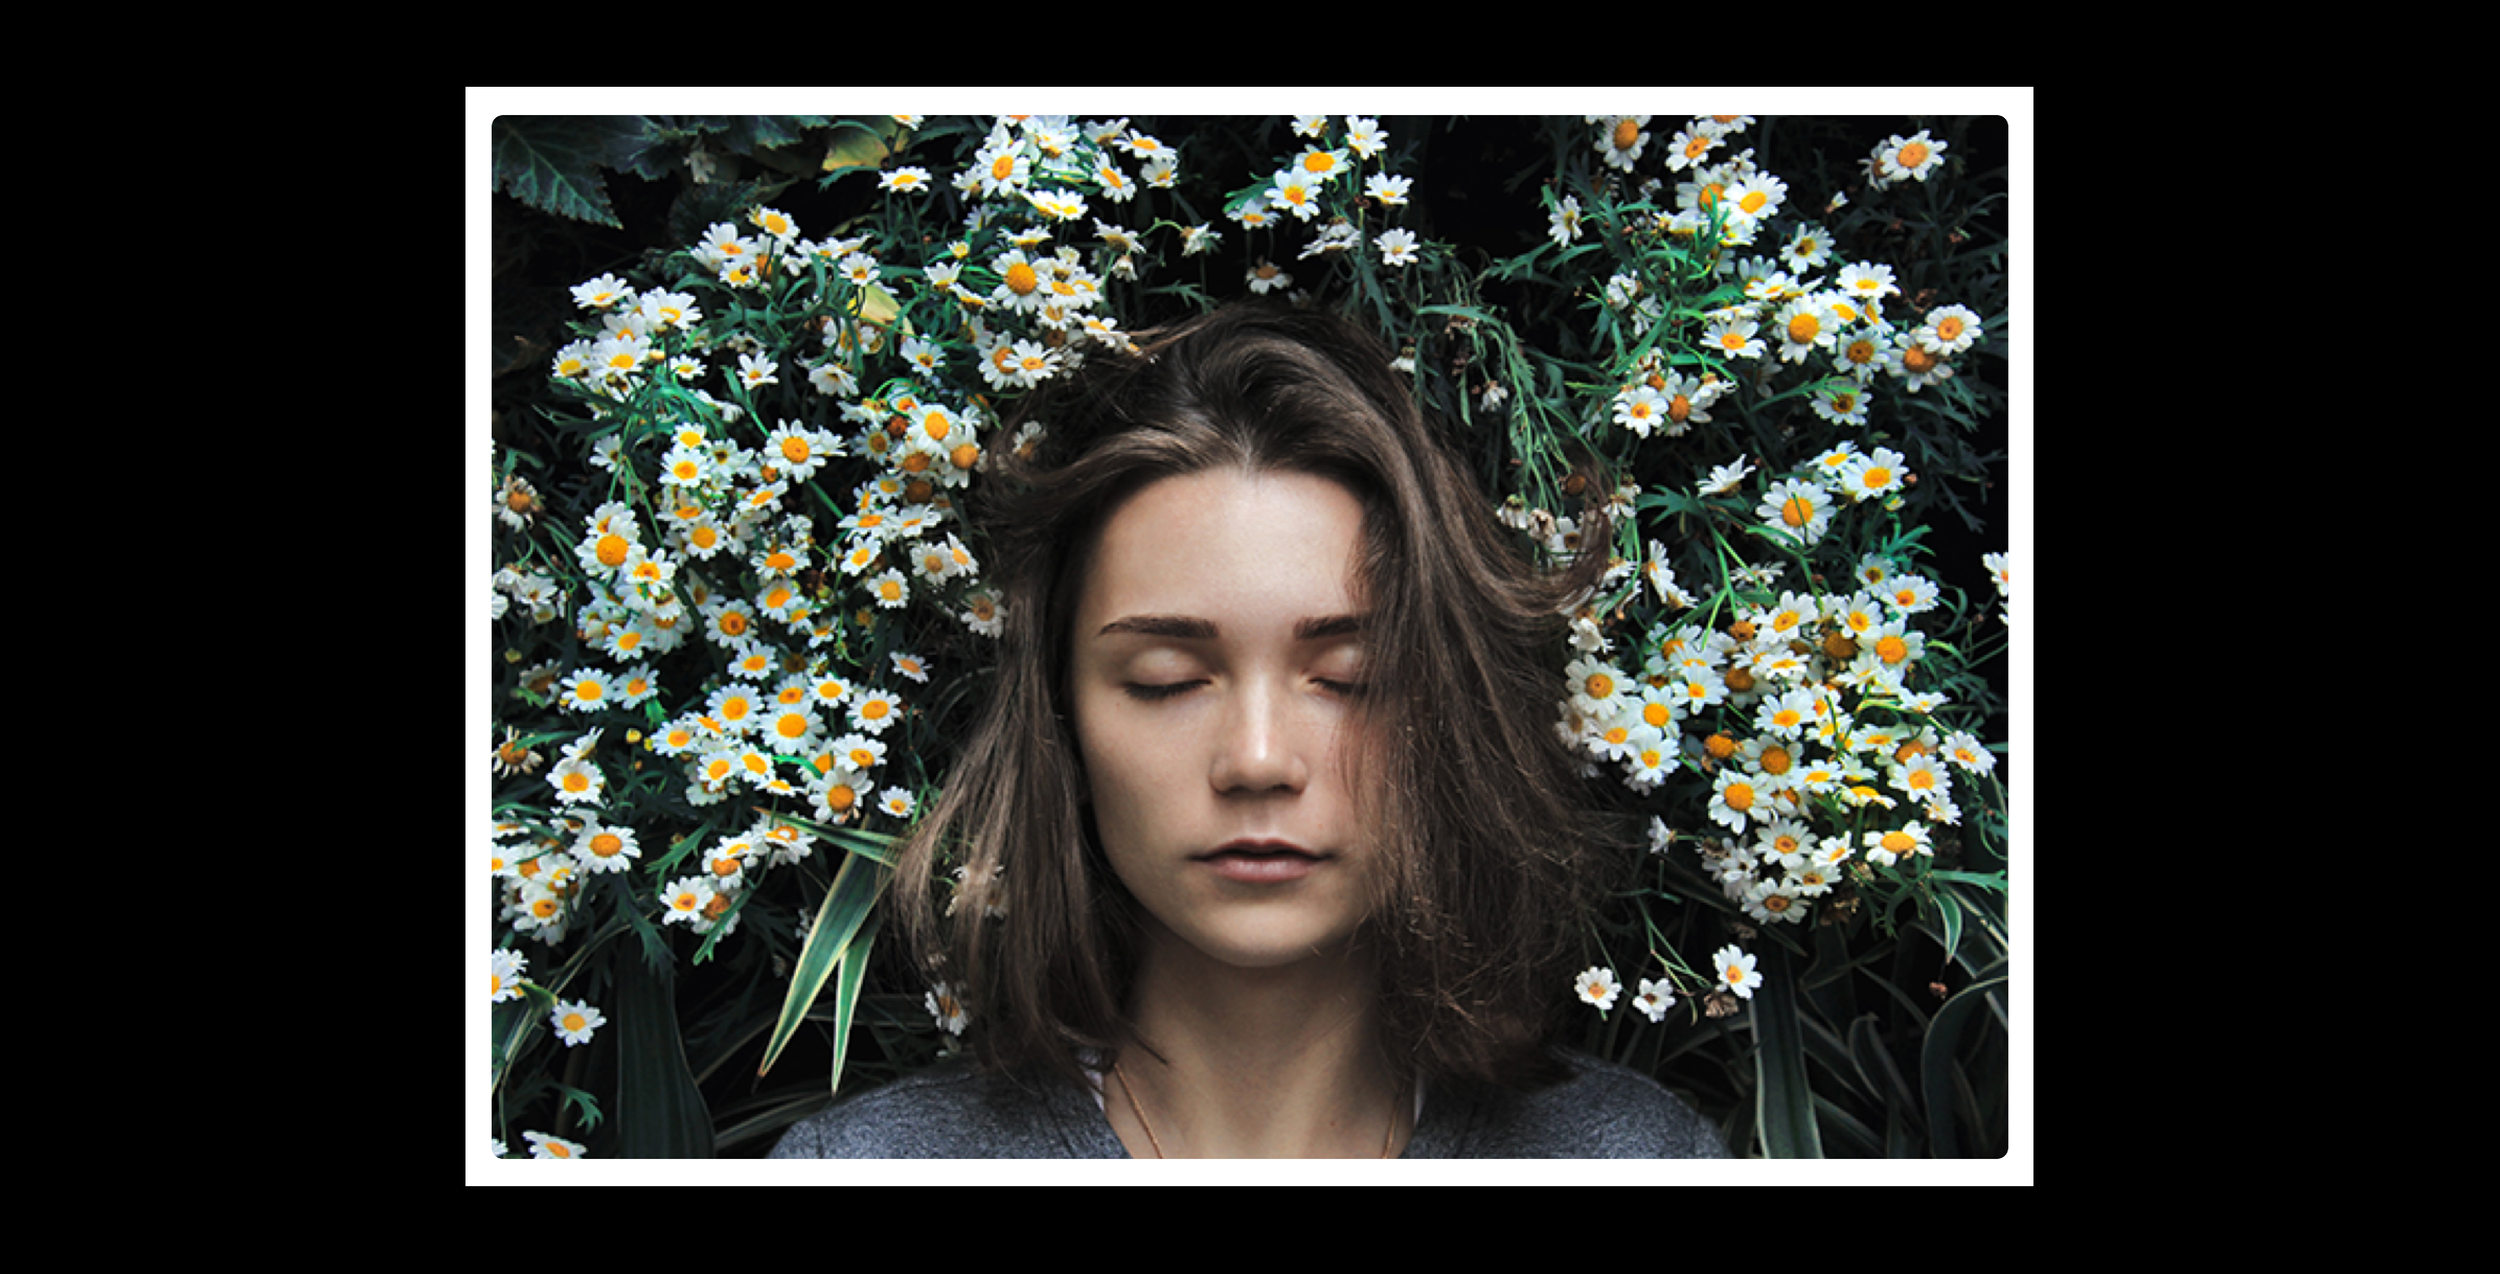
Visual Design
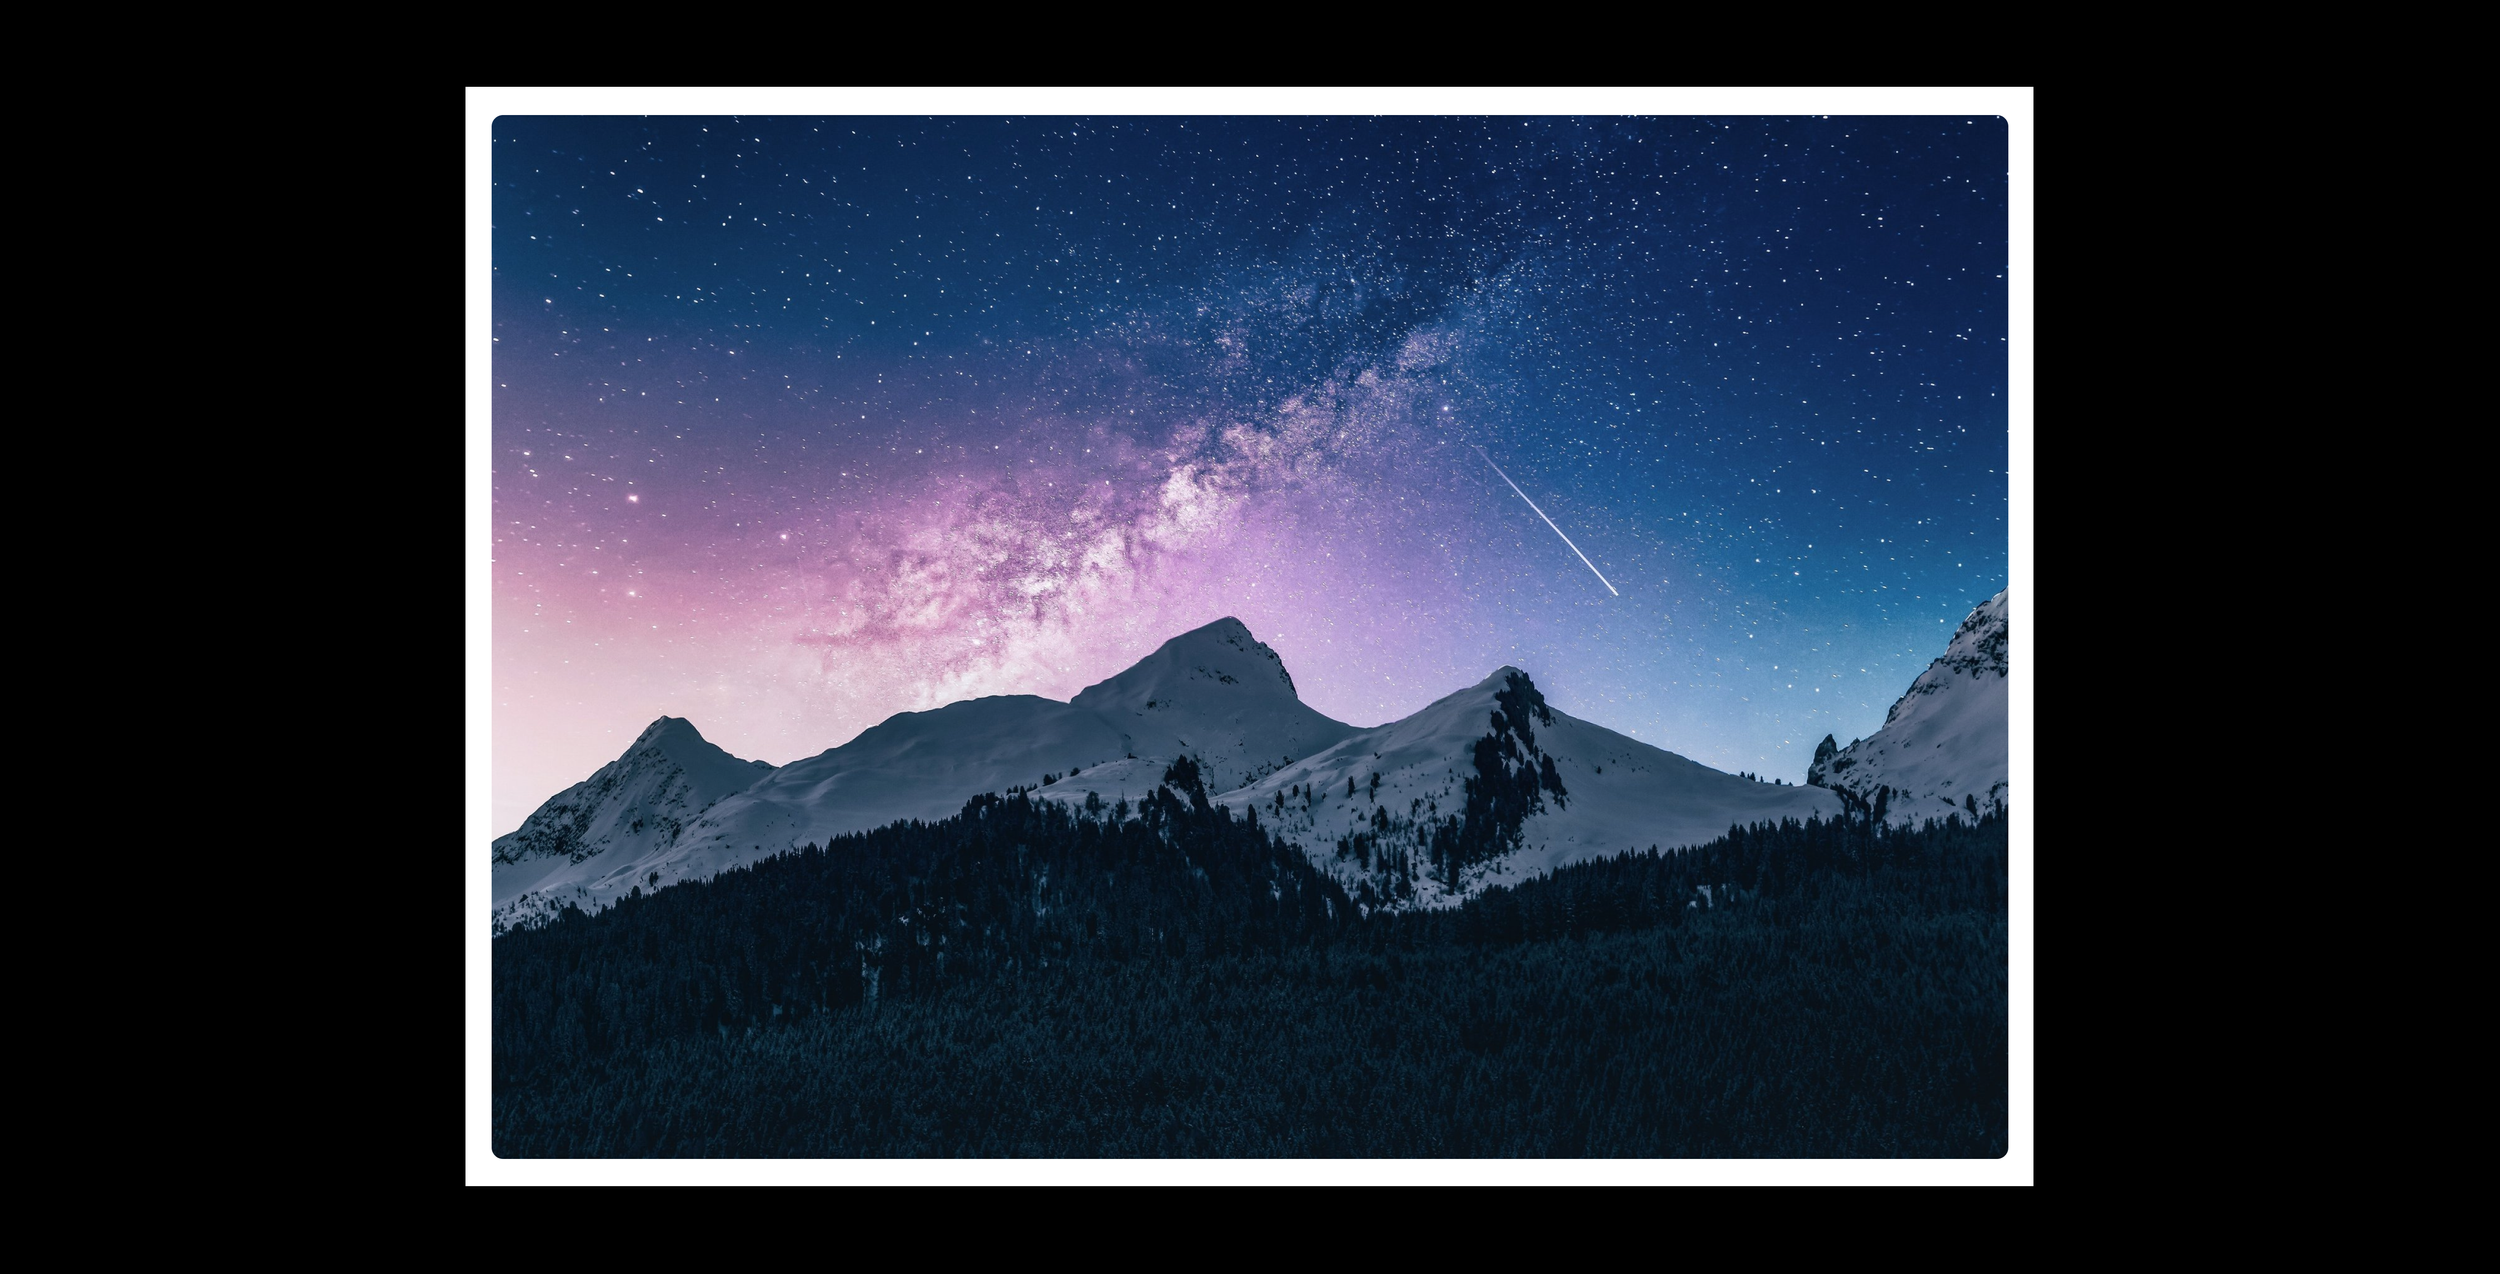
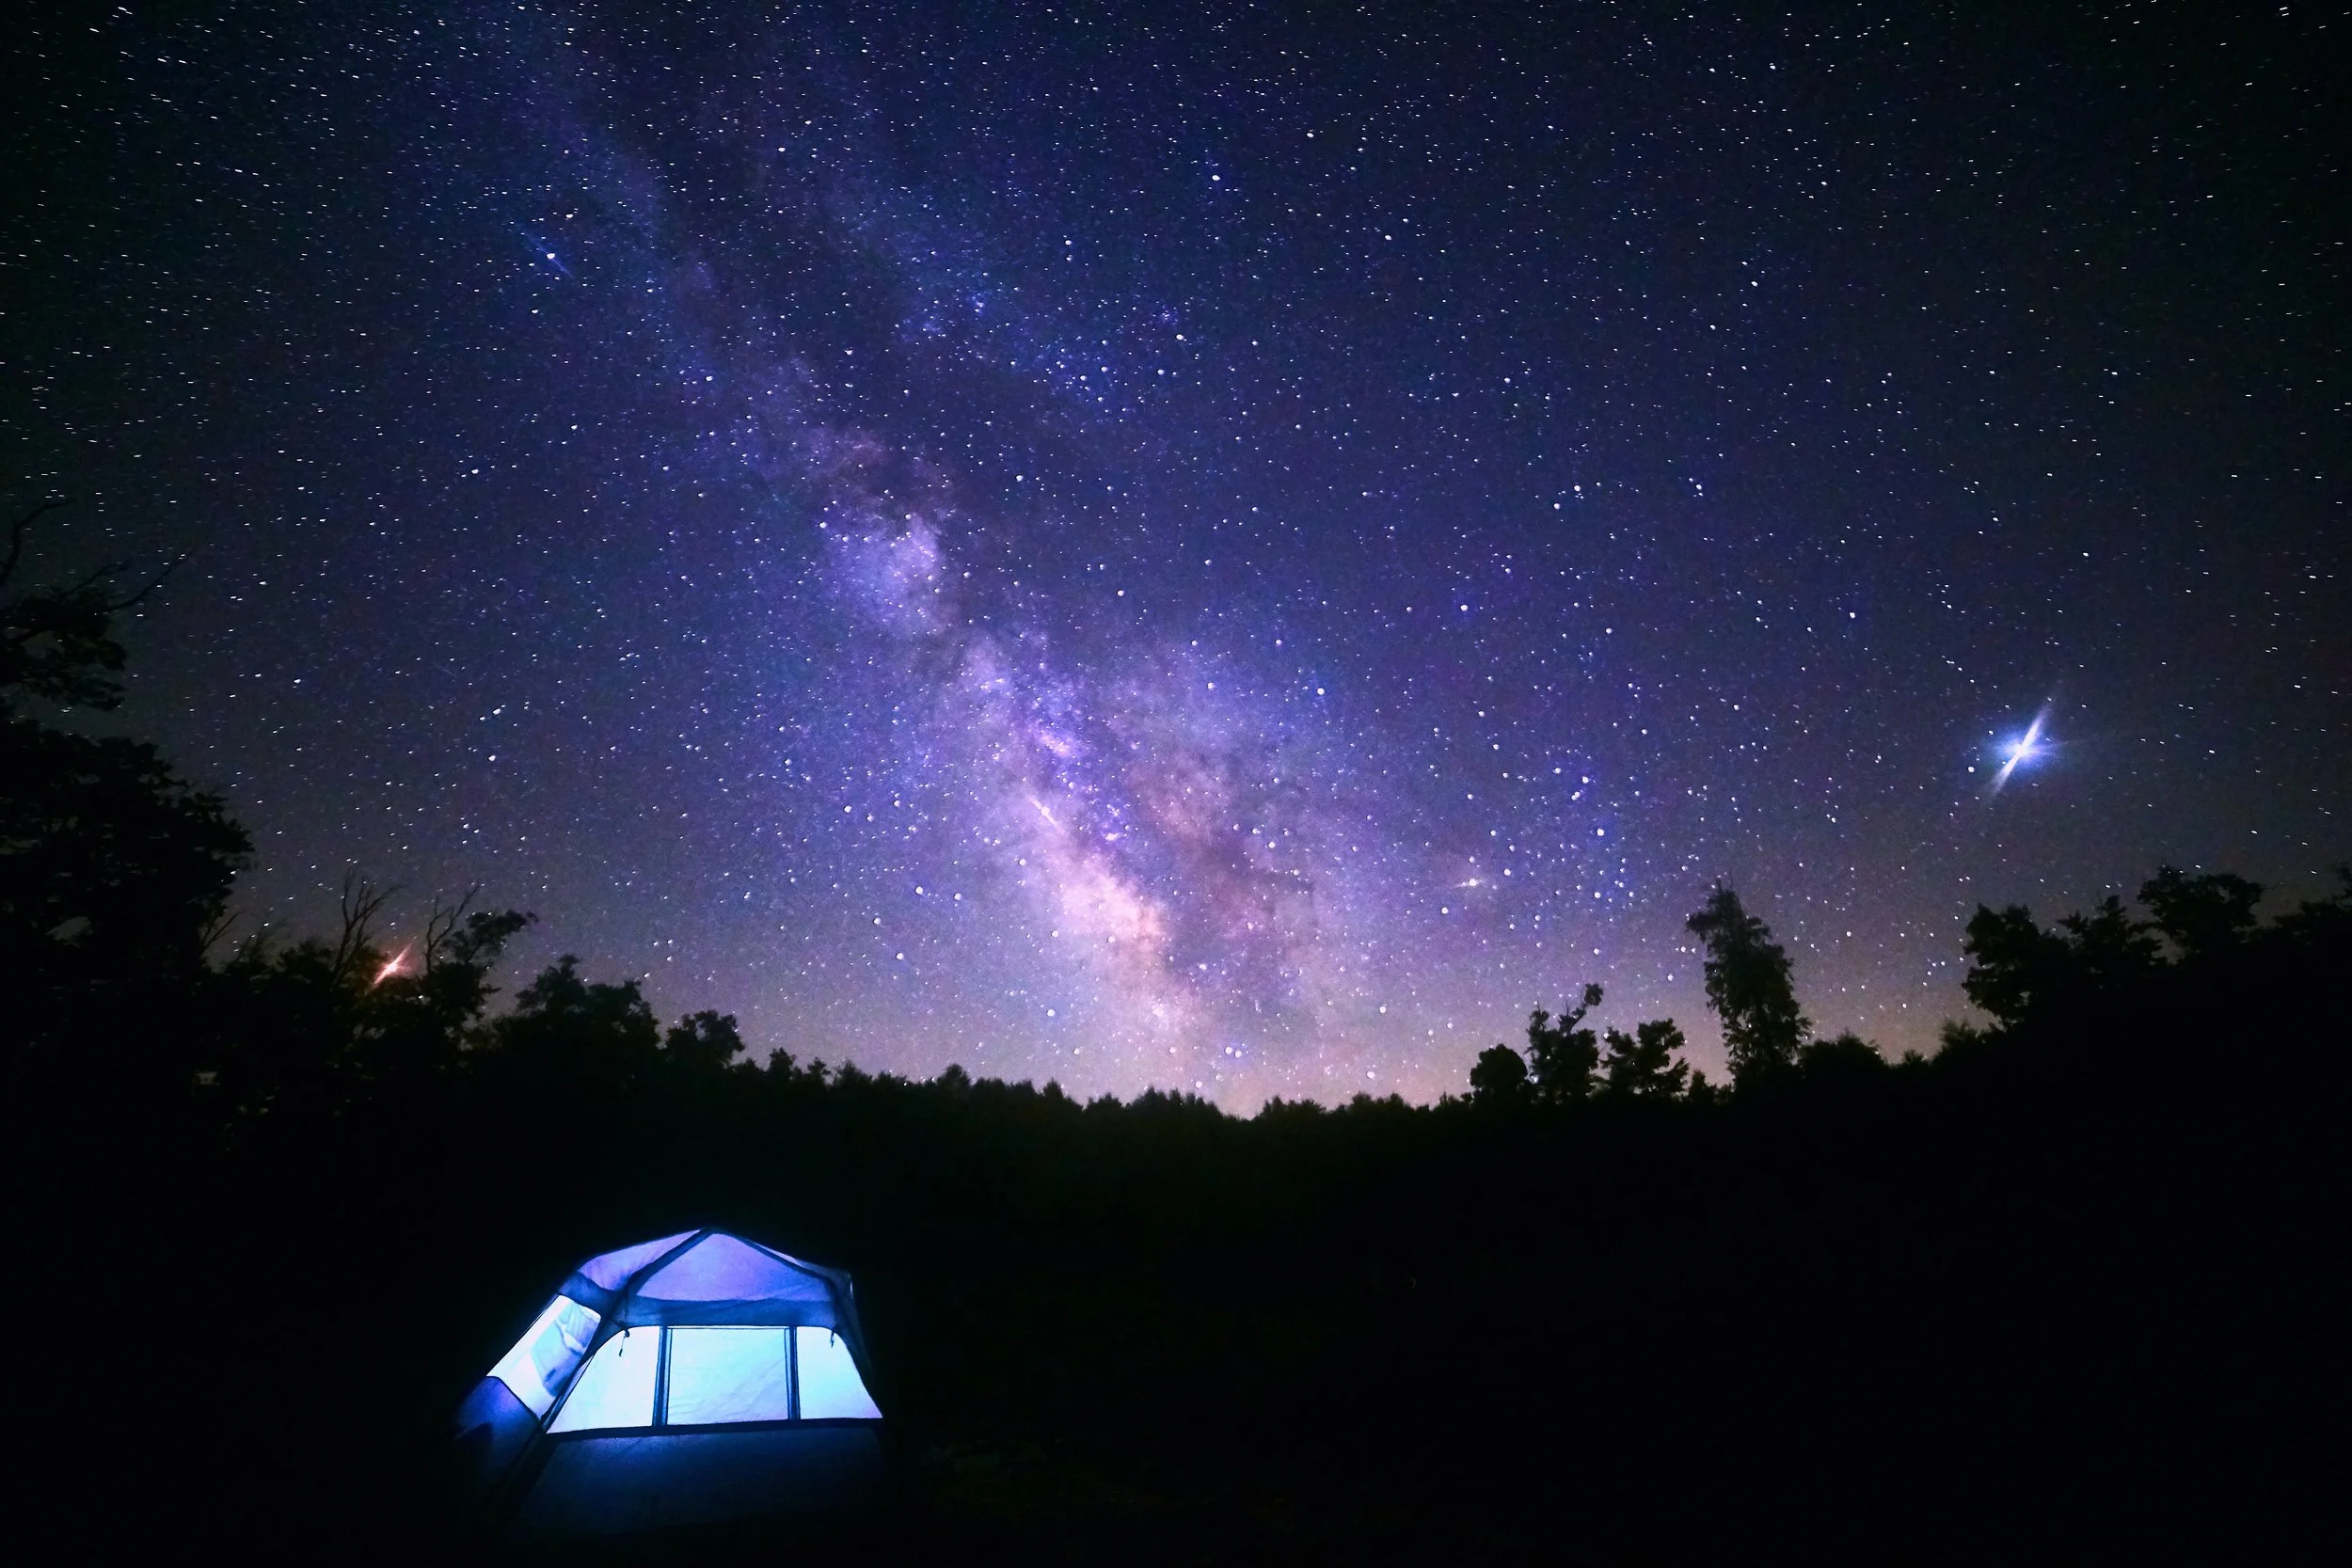
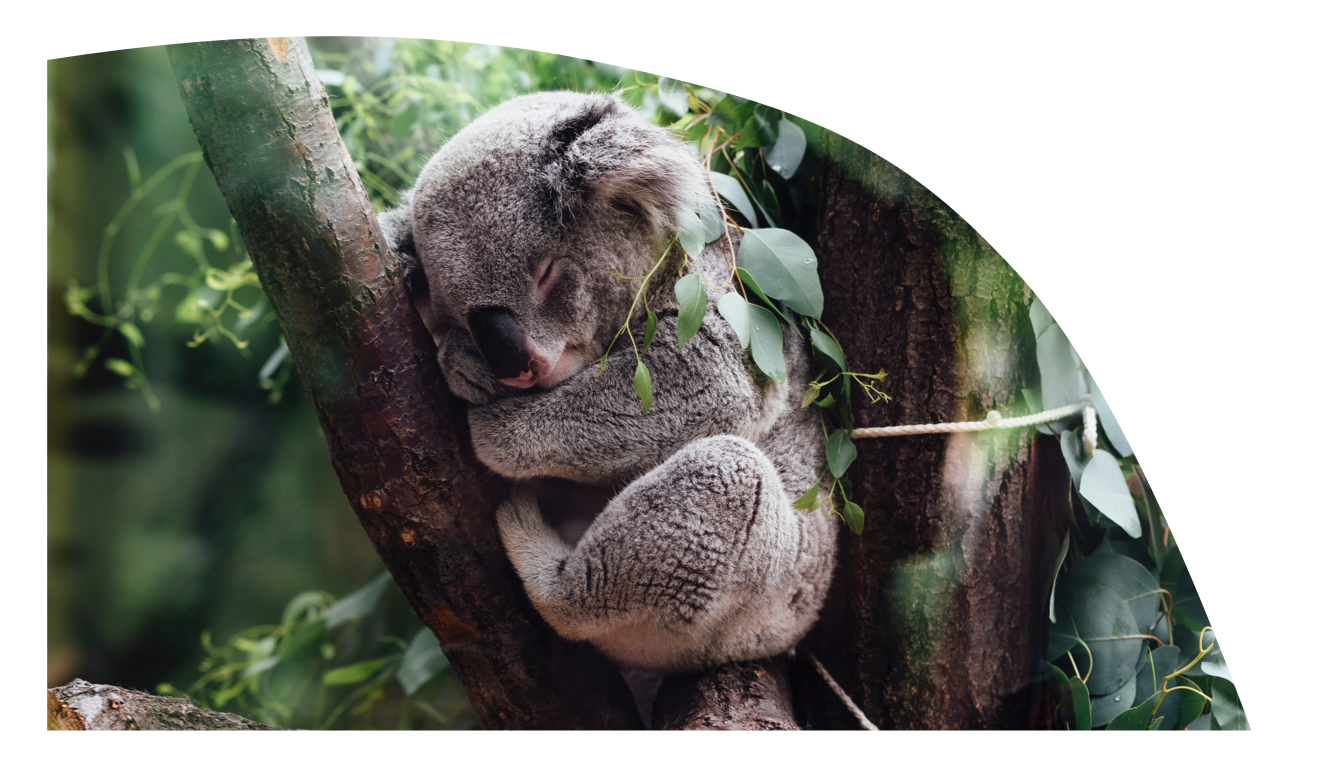
Cool colors, crisp text, and a changing layout emphasize the imagery and themes that surround restful sleep and natural rhythms. The biological process of sleep is shown through images of people, animals, and daylight.
The key points and data are translated into colorful and related infographics, and a variety of content communicates multiple themes for people in diverse lifestyles but with the overall focus on sleep health-science.
Science Reframe
3 Themes Revisited
UX Design
“NREM & REM, The Sleep Stages”
Content: “Non-rapid eye movement (NREM) and rapid eye movement (REM) characterize your 4 sleep stages. The stages determine how you relax, rest, and dream. A cycle of sleep through these stages takes 1.5 - 2 hours.”
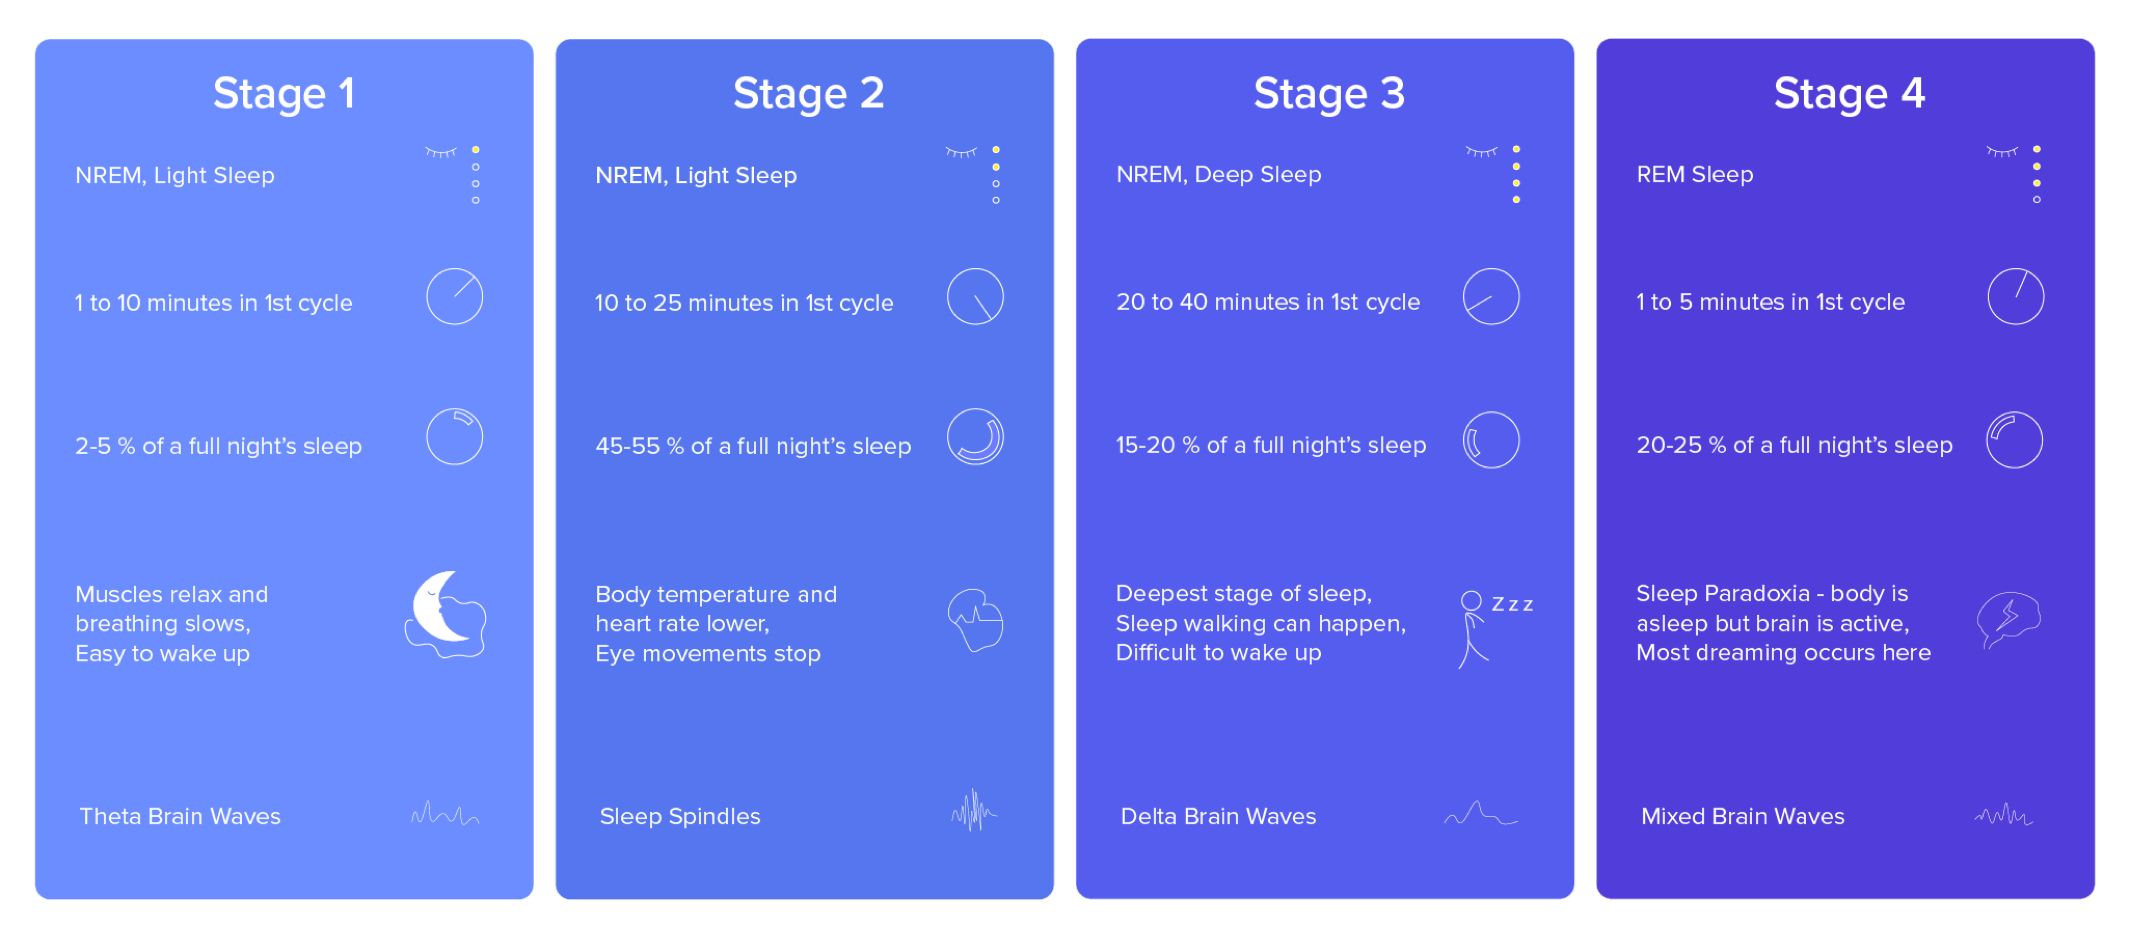
4 Sleep Stages, Infographic # 1
Visuals and text combine to communicate the 4 Sleep Stages’ similarities, differences, and details.
Science Visuals
The infographic visually represents the 4 sleep stages and each stages individual characteristics. NREM + REM are the beginning points of the infographic, because they frequently appeared and were commonly emphasized in the online articles.
The infographic identifies the type of eye movements, time in the 1st cycle, % of a full night’s sleep, a few physiological changes, and brain waves that occur in each sleep stage. The visual paneled design better represents information about each stage like a sleep card with its individual details and characteristics
Instead of a sequential order of 1, 2, 3, and 4 through each of the 4 stage’s of sleep, people navigate through stage 1, 2, 3, then return to stage 2, before progressing into REM sleep in stage 4.
People move through the 4 stages of sleep multiple times during 7-9 hours of rest. A single cycle of sleep takes around 1.5 - 2 hours to move through for middle aged adults, and they would move through around 4 - 5 cycles of the 4 sleep stages during their sleep.
Non-rapid eye movement occurs in 3 sleep stages (#1, 2, 3), with the alpha, beta, theta, sleep spindles, and delta brain waves characterizing the light (NREM) , heavy (NREM), and transitionary (NREM) sleep patterns. REM sleep happens in 1 sleep stage (#4), with mixed brain waves signifying the active (REM) sleep pattern.
4 Sleep Stages, Infographic #2
Toddlers: 11 - 14 hours
Children: 9-11 hours
Teenagers: 8-10 hours
(Young) Adults: 7-9 hours
Well-Aged: 7-8 hours
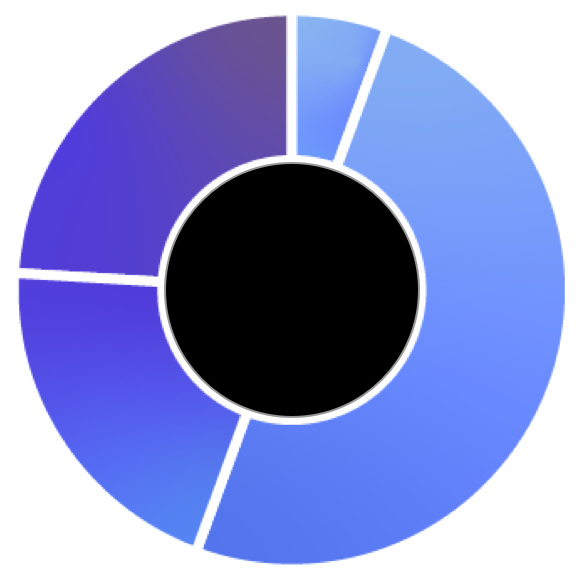
A 2nd infographic portrays data about the 4 Sleep Stages Total Duration including every cycle of a person’s sleep, while the 1st infographic details the 4 sleep stage’s individual characteristics per a single cycle of a person’s sleep.
Stage 1
NREM
2- 5%
Stage 2
NREM
45-55%
Stage 3
NREM
15-20%
Stage 4
REM
20-25%
A third of people’s lives is spent asleep, and as we grow and develop, our sleep cycles change too.
Recommended Sleep:
“Full Night’s Sleep % in Each Stage”
The 2nd graph focuses on communicating information about the total amount of time people would rest in each of the 4 sleep stages. A % of time and the NREM and REM signifiers, which often characterize the sleep stages in online health articles, represent the stages duration for a person’s full night of rest.
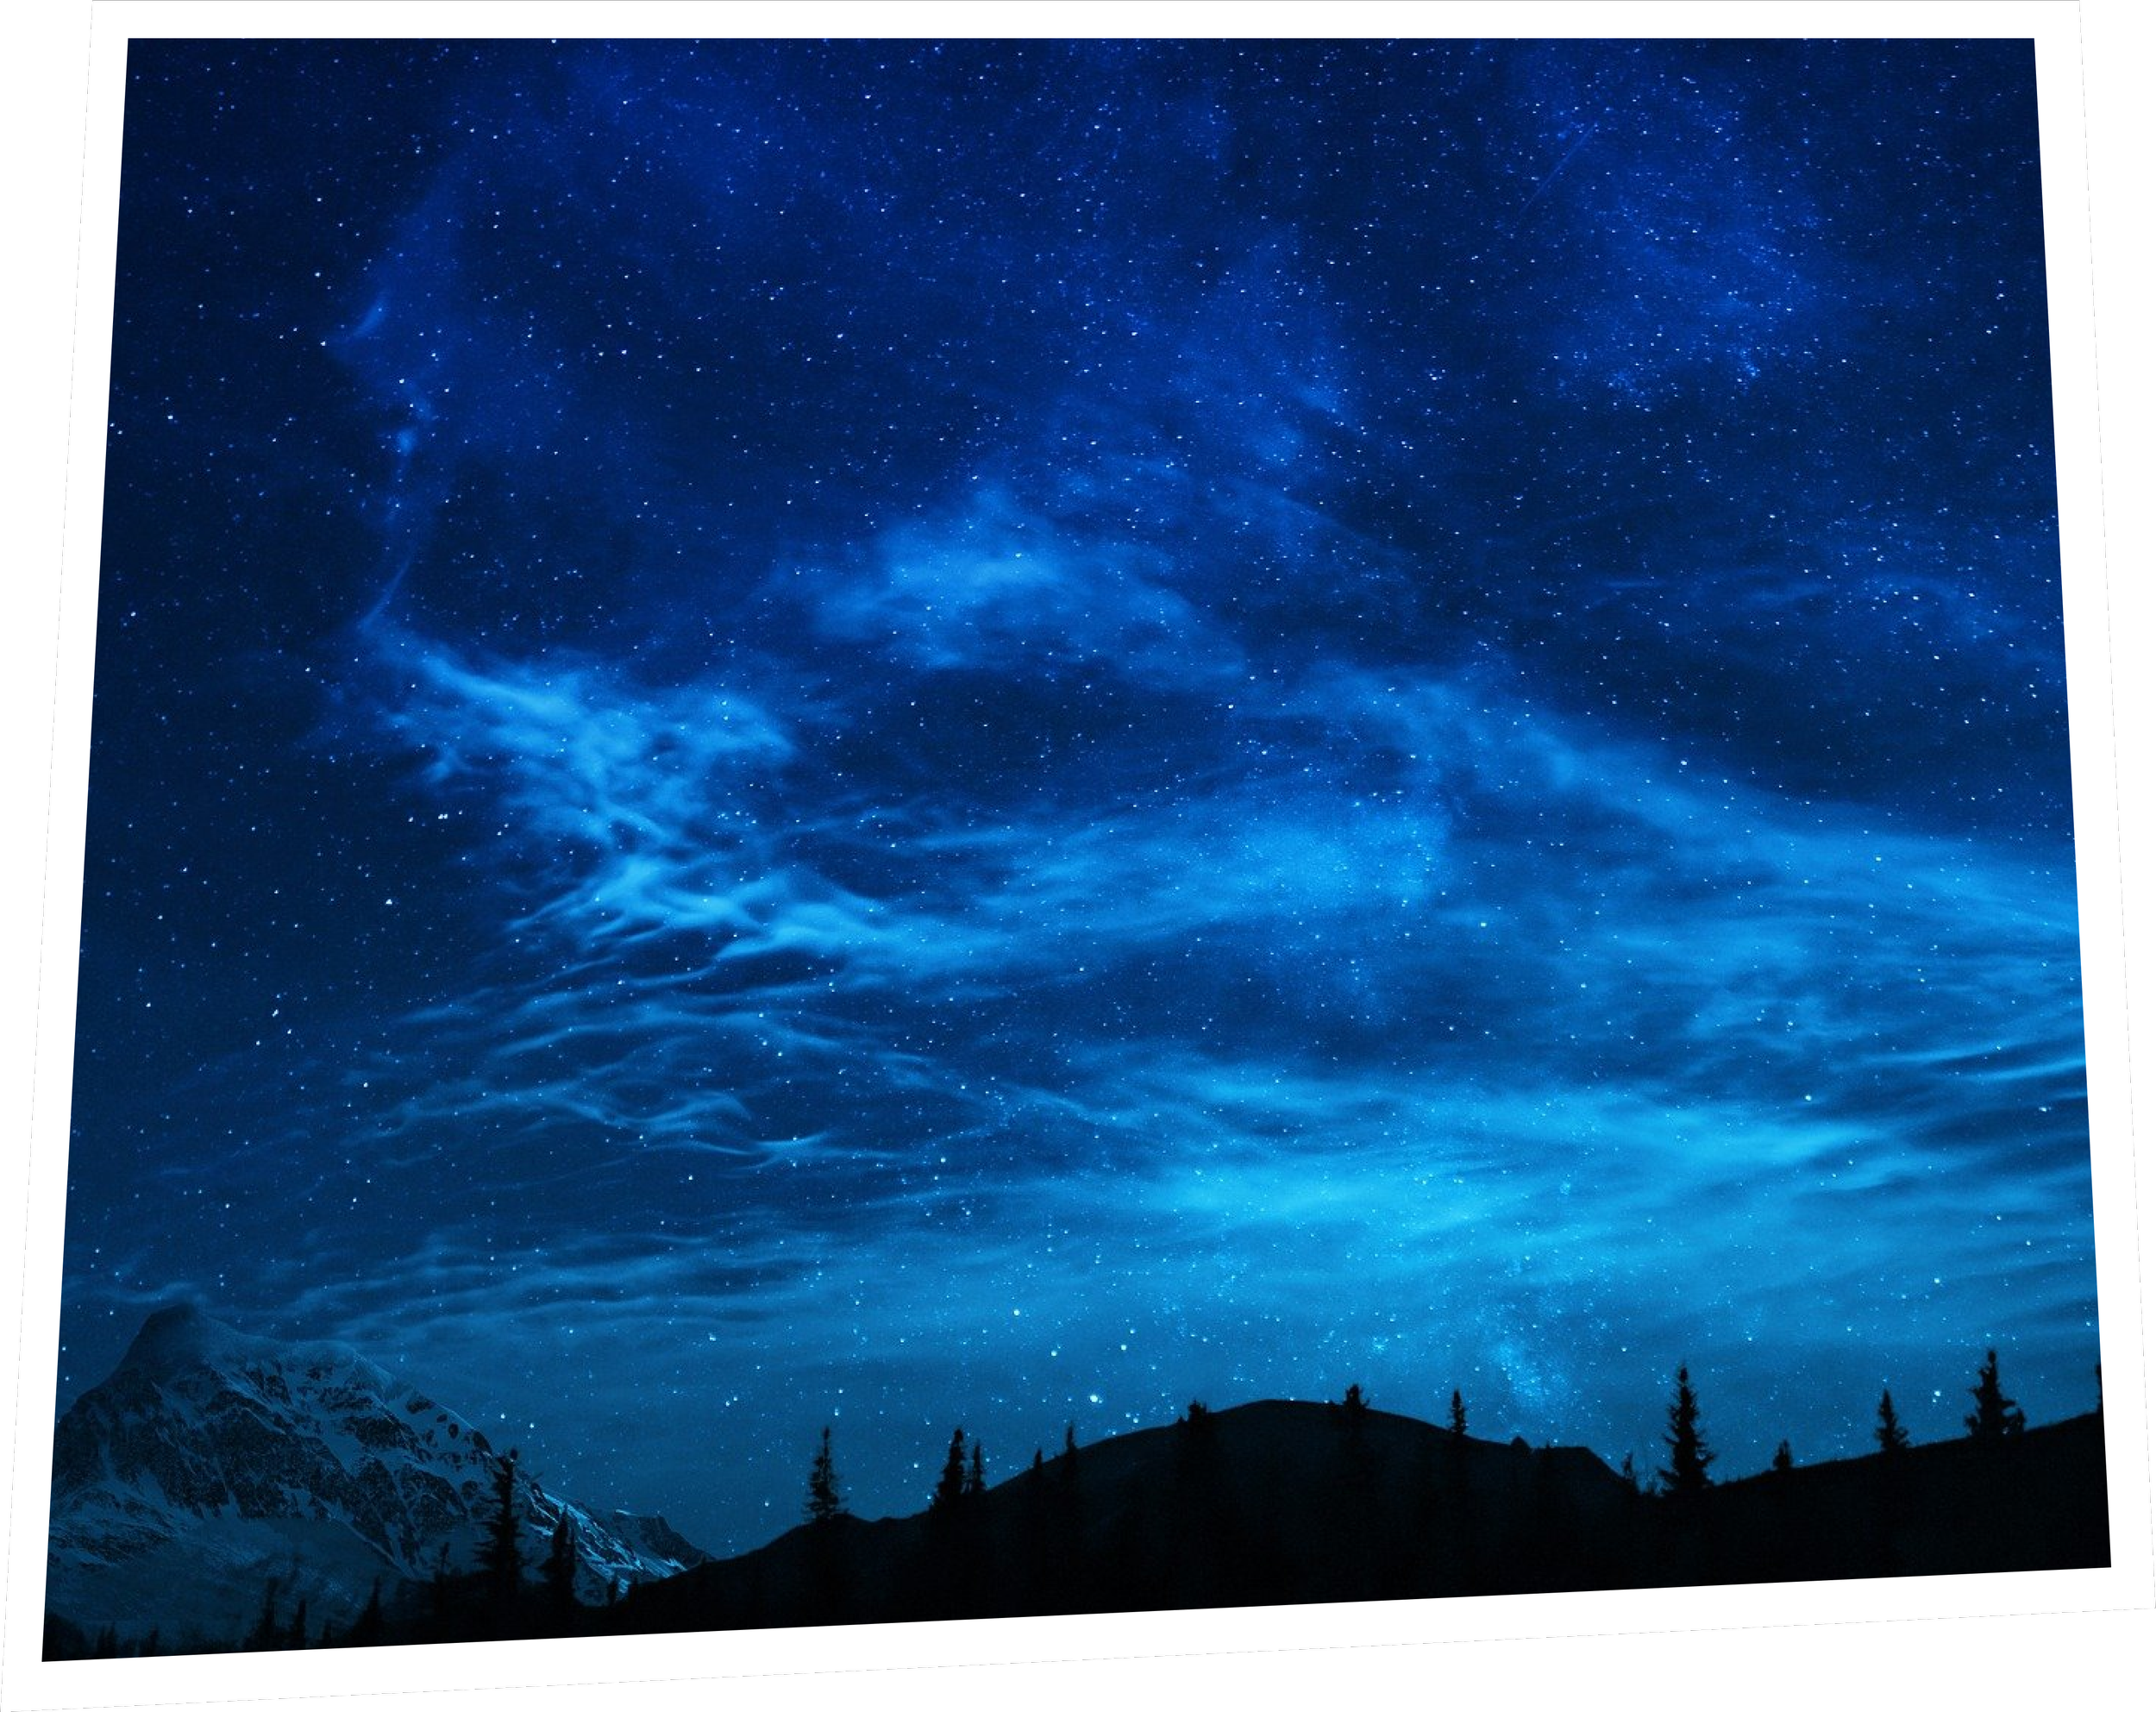
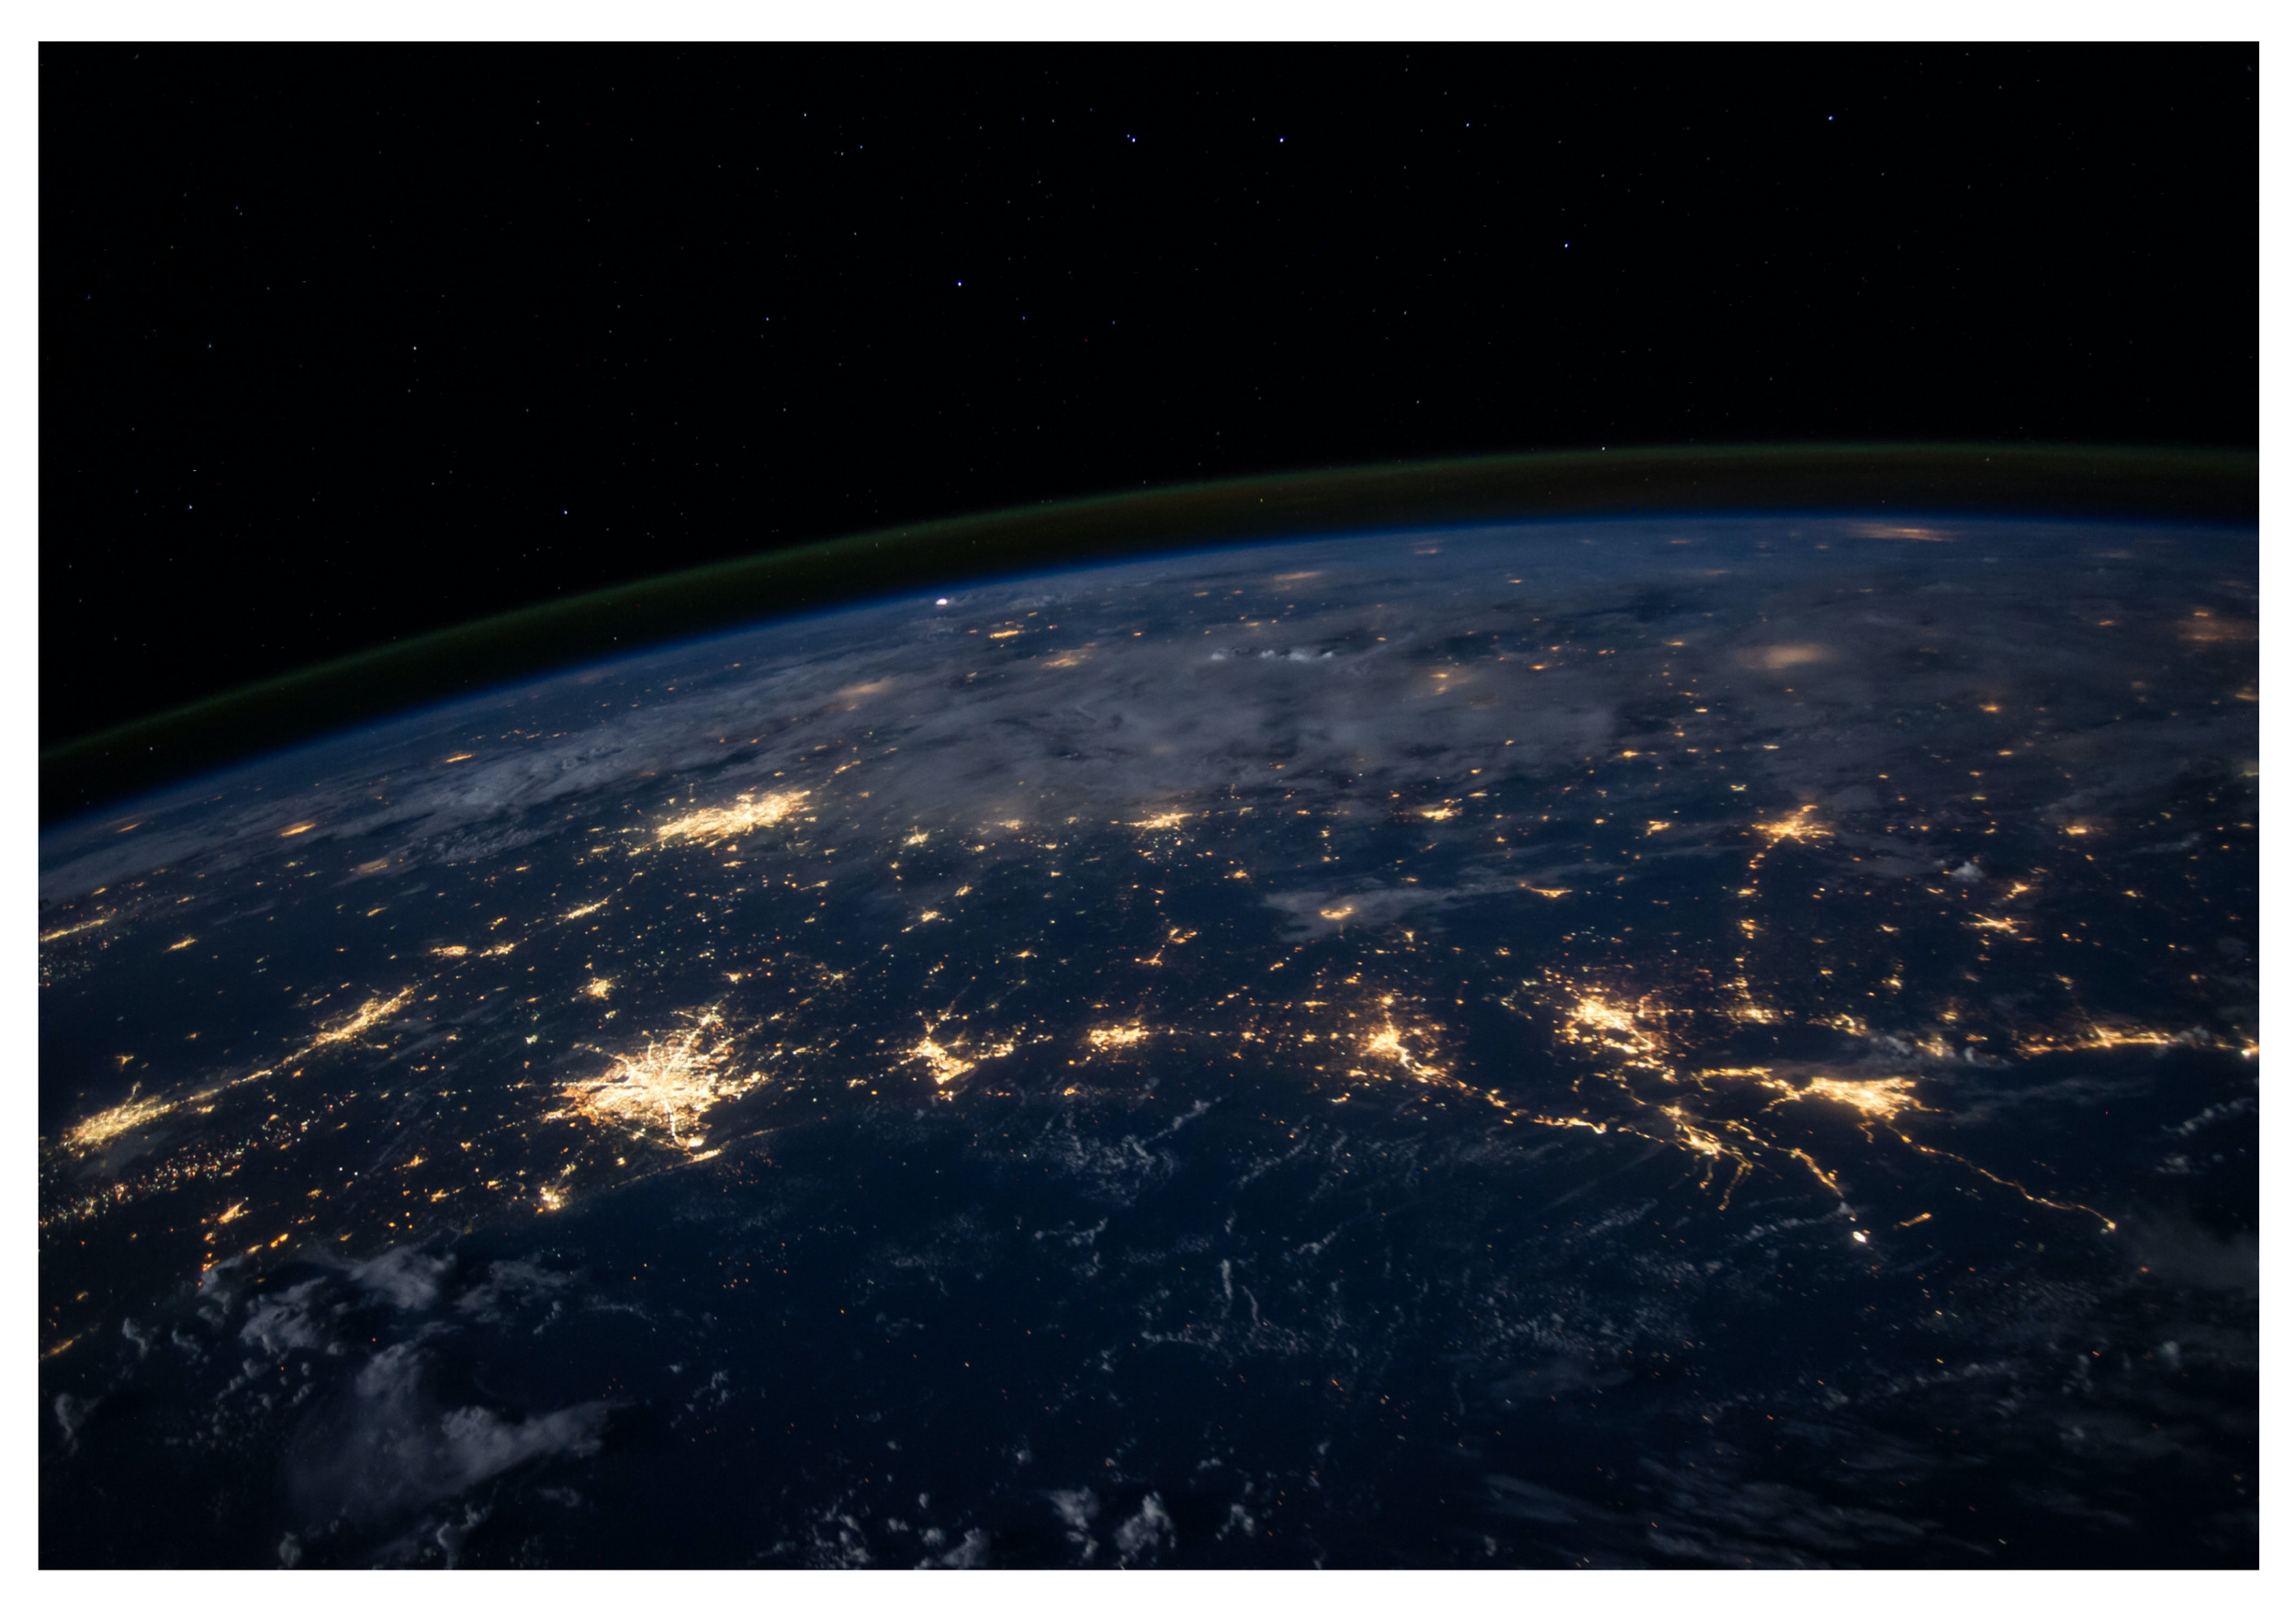
A circular graph better represents the total time in each sleep stage during a person’s overall sleep in a night. The shifting cool colors represent a night sky as light moves through day, dusk, and night, and the ombre hues indicate a change between the sleep stages that people move through during the stages and cycles of sleep.
The text section indicates the total time people are recommended to sleep based on their age and development, while the infographic section represents the total time people move through each stage of sleep during rest. As indicated by a % range, people will vary in how much time they are in each sleep stage, and similarly as shown by a range of hours, people will fluctuate with the total quantity of sleep that is stellar for their rest, health, and function.
For instance, an adult who rests for 7-9 hours would move through 4-6 cycles of sleep, while a toddler who rests for 11-14 hours would move through 6-10 cycles of sleep. A sleep cycle lasts on average 1.5 - 2 hours. While the amount of cycles would vary based on the quantity of sleep, the % of time in each sleep stage during the sleep cycles would stay relatively consistent.
With the amount of information discovered on sleep, 2 infographics were created to group relevant information together but communicated through their own visual design. With details about the sleep stages’ characteristics and the total duration people sleep in each stage, the infographics visually connect with close proximity and similar colors and they informationally relate with their themed sleep science information but with an overall focus linking the content to people’s sleep processes.
2 Infographics + Text Combine for Efficient + User-Friendly Communication
Both Infographics, the 1st, “NREM & REM, the Sleep Stages,” and the 2nd, “Full Night’s Sleep % in Each Stage,” combine for visual communication of the sleep process and relevant data for readers engagement, learning, and understanding of the content for the health-focused email newsletter design. The focus of the infographics and their related text was to portray the micro and macro characteristics, similarities, and differences of the 4 sleep stages and to show how much sleep is recommended for various age groups. The sleep themes are comprehensively communicated to readers and the health messages are efficiently presented in a way to be more readily remembered through 2 interconnected visuals and text on sleep science.
⬤ ⬤ ⬤ ◯ ◯ ◯ ◯ ◯ ◯
⬤
◯
◯
◯
⬤
◯
⬤
◯
◯
Sleep + Recharge Concept to Newsletter, but for email!
A Final Newsletter which brings together UX Design, Visual Design, and Relevant Research for a Sleep Read that Keeps People Going.
The email newsletter design was created in the Sketch Program and was sent as a compressed pdf document so that it would be a file size that would easily be sent though email. Originally, the downloaded “Final” design was too large and so the reduced file size was able to attach the newsletter as a pdf. file rather than having to be sent as a Google Drive file. This additional step of compressing the file added to a seamless user-experience for people to access and read newsletter with fewer steps on their side. People were able to view the 1 page newsletter on mobile or a computer on any email site with 0 to 1 user steps, scrolling down or a clicking download, to read the attached health message.
“Sleep + Recharge” Email Newsletter
Project Goals + Visual Application
Benefits
⦾ Goal: Show the Impact of sleep on the body
⦿ Visual Application: “Benefits of Sleep,” lead the way with a brief list of some sleep benefits and descriptions of 3 of the benefits with relevant icons, such as the person, lightning bolt, and brain. This section links into “How To Do It,” with a list of ways to fall asleep.
How to fall asleep
⦾ Goal: ways to improve sleep patterns
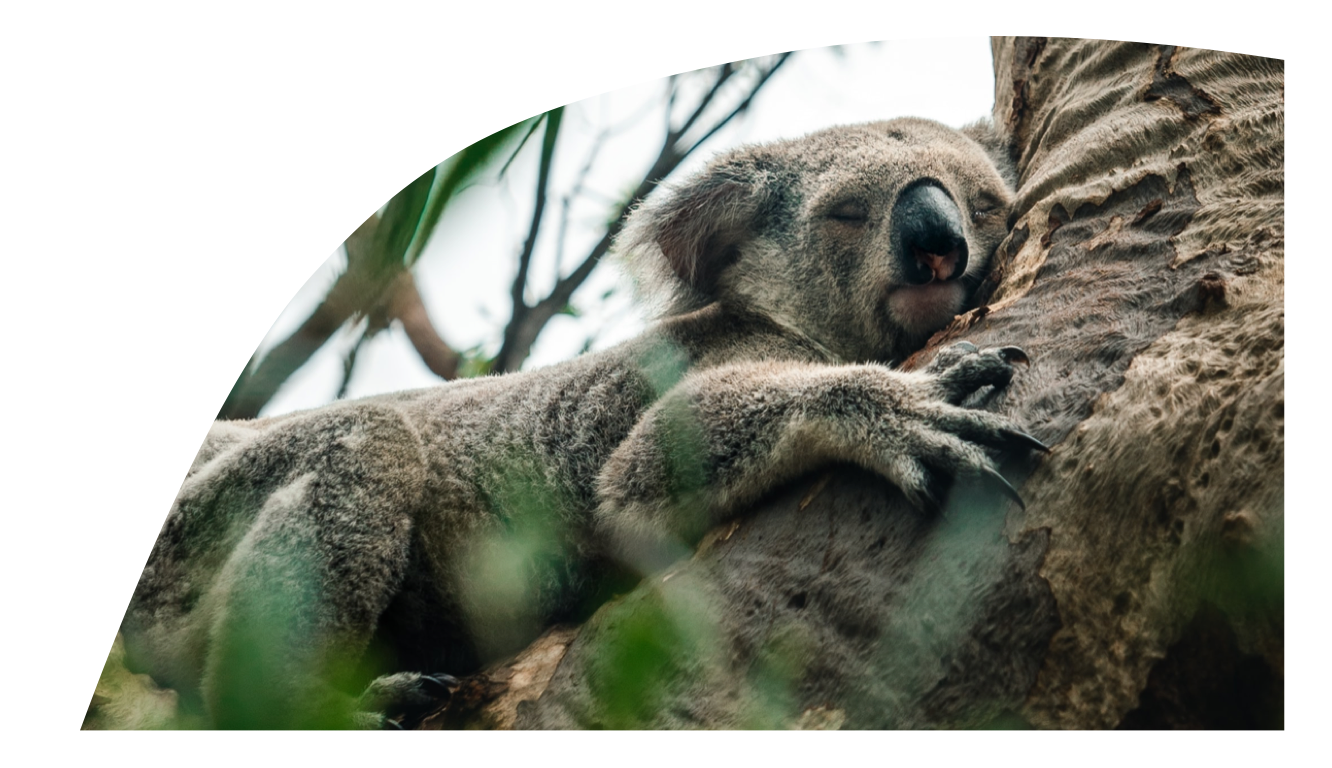
⦿ Visual Application: The “How to Do it,” section lists ways to fall asleep and is anchored by a picture of a sleeping koala. The green color and sleeping koala end the section about sleep benefits and transitions into the next section about the sleep process.
Brain
⦾ Defining the sleep process
⦿ Visual Application: A description about how sleeping before 12am benefits the brain and body is shared before diving into the sleep process. The infographic describes this process and how it occurs in the brain is shared along with information on REM + NREM.
Sleep Stages
⦾ How much sleep is best for various ages
⦿ Visual Application: The sleep stages are communicated through each Infographic panel. The cool colors connect to the a night sky and the text links to icons that represent the characteristics like, NREM & REM activity, brain waves, and physiological changes.
Cycles
⦾ Goal: Sleep Cycles Around Us
⦿ Visual Application: The 2nd infographic represents the total time people are in each stage during their hours of rest and with that cycles of sleep. Additionally, “Fun Facts,” communicate other information about the sleep cycles, such as with circadian rhythms.
News Letter Delivered
The newsletter read brought together user research, visual designs, and a themed layout for a modern read that informs people about health-science on sleep. The online article data and insights are translated into infographics with both imagery and text so that people are able to learn more about the sleep process in a clear, collated, and connected presentation. Additionally, easy to read text, colored icons, and natural imagery implement the project’s goals with health science on sleep being an enjoyable and informative read for people.
‘Final Newsletter’
People remember around 80% of what they see versus 10% of what they hear and 20% of what they read. Link
Resources, Links, & Articles
“A sleep cycle lasts on average of 1.5 - 2 hours, so sleeping 7.5 hours is equal to around 4 to 6 cycles of sleep.”
Sleep Cycle
Active Brain During Sleep
“Some parts of the brain use more oxygen and glucose while asleep than when awake. We used to think that everything shuts down when we sleep, but scientists have discovered that our brains are active in sleep.”
Remembering Visuals and Words
“People will remember about 65% of what they see in a visual while people will remember about 10% of the information they hear out loud.”
24 - Hour Cycles
Changing Sleep Patterns
Researcher Color Efficiency
“You have a master clock in your brain that is influenced by the light and dark of a 24-hour day. The circadian rhythm, from “circa diem” (around a day), signals your sleep.”
“The first 3 hours of sleep have the deepest stages of sleep (Slow wave sleep). Later in the night, people have more vivid dreams, in REM sleep.”
“Researchers spent 39% less time finding information in a document with visuals, colors, and charts.”
Washing Machine Cycles
Lack of Sleep and Focus
Improved Reading Comprehension
“During sleep, your brain is washed with cerebrospinal fluid, like a washing machine on cycle. This process helps to clean out toxins and refresh it.”
“People with a lack of sleep are less focused and experience mood changes.
“Reading comprehension is improved by 50% through the use of infographic design and increases by 70% when color is used in visual designs.”
Cycles, Fun Facts
Other Sleep Facts
Learning + Tech
. . . . . Link . . . . .
. . . . . Link . . . . .
. . . . . Link . . . . .
. . . . . Link . . . . .
. . . . . Link . . . . .
. . . . . Link . . . . .
Sleep Resources
. . . . . Link . . . . .
. . . . . Link . . . . .
. . . . . Link . . . . .
The newsletter design included resources for people to learn more about health science and other information on the benefits, actions, processes, data, and fun facts about sleep through the APA style links to online articles and journals at the end of the 1-page design. With a design focused on science and translating useful information into quickly read and understood text and visuals, main resources that were used for the content were available for people to read in more detail and at their own leisure whenever they decided to look more into the health science.
People share and like infographics 3 xs more than any other type of content + posts that include images produce 650% higher engagement than text-only posts. Link
Resources, Content Creation and Science Translation Focus
With a mix of online articles and a few publications, there was a way for people to be able to read more if they have the time and want to look into the topics in more depth. A place to share the resources was included at the bottom of the newsletter in the green footer. While key points were pulled out of the resources and into the newsletter, people still might want to take their own dive into the research and have quick access to the links so they can learn more about how sleep works and how it influences their life.

People process images 60,000 xs faster than written or typed text. Link
Reflection
This project brings together health with design for people to learn more and see how things can work into their lives. Learning something is pretty cool, but when you see it work into your life, that can be even cooler, like a hot chocolate. After completing the GA course, the class was encouraged to work on a project that aligned with our interests.
Realistically, it took more time, energy, and organizing to complete the newsletter than I had initially estimated. With a better workflow, I think the creation part of the newsletter would be faster. This would result in more time for other projects and time to learn new UX skills and UX workflows for health-related projects or other topics.
People spend on average 10 seconds reading a brand email + people will spend less than 15 seconds activity reading on a website. Link
Additional Steps
With a mix of online articles and a few publications, there was a way for people to be able to read more if they have the time and want to look into the topics in more depth. A place to share the resources was included at the bottom of the newsletter in the green footer. While key points were pulled out of the resources and into the newsletter, people still might want to take their own dive into the research and have quick access to the links so they can learn more about how sleep works and how it influences their life. Additionally, “Fun Facts,” about other sleep cycles wrap up the article along with resources for people to explore sleep science in their own time. Later, next steps could be writing about the fun facts or the cycles.

90% of the information processed by the brain is visual + it takes only 13 milliseconds for the human brain to process an image. Link